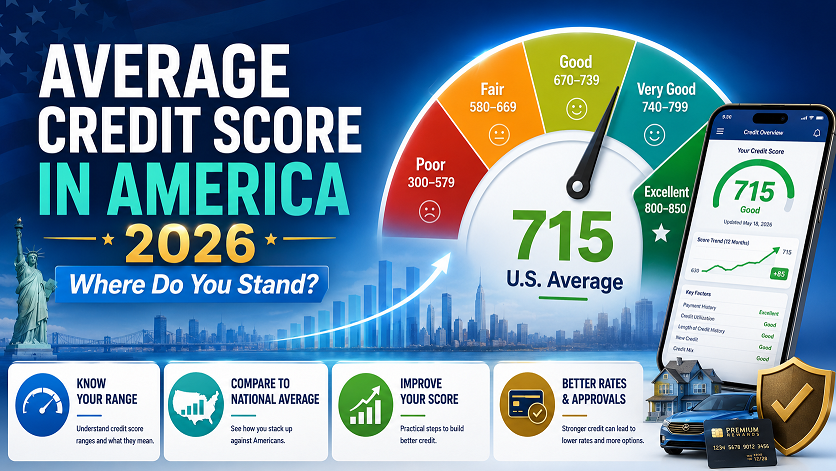
Average Credit Score in America 2026 — Where Do You Stand?
The average FICO score in America is 715 as of the most recent full-year data — down from the pandemic-era peak of 718 in 2023 and marking two consecutive years of national score declines. A score of 715 falls in the “Good” range (670–739). If your score is above 715, you are above the national average. Above 740, you are in the top third. Above 800, you are in the top 20%. This guide breaks down the average score by age, state, income, and scoring model — and tells you exactly what your number means for your financial options in 2026.
Knowing the average credit score in America serves two purposes. First, it gives you a benchmark — a way to understand not just whether your score is good or bad in absolute terms, but where it places you relative to your fellow Americans. Second, it reveals something important about the economic moment we are in: the average is falling, and understanding why it is falling helps you protect your own score from the same pressures.
This guide gives you the most current and complete picture of average credit scores in America for 2026 — by age, by state, by income level, and by scoring model — along with an honest assessment of what each score tier means for your real-world financial options.
The National Average Credit Score in 2026
The most widely cited measure of the national credit score average is the mean FICO Score 8, published annually by Experian using data from all three major credit bureaus. Here is the recent trend:
| Year | Average U.S. FICO Score | Change | Key Driver |
|---|---|---|---|
| 2019 (pre-pandemic) | 703 | — | Baseline year |
| 2020 | 710 | +7 | Stimulus payments, reduced spending, forbearance programs boosting scores |
| 2021 | 714 | +4 | Continued forbearance, low delinquency rates |
| 2022 | 716 | +2 | Bureau voluntary medical debt removals begin |
| 2023 (peak) | 718 | +2 | Pandemic-era peak — best average in U.S. history |
| 2024 | 717 | −1 | Student loan repayment resumption, inflation pressure |
| 2025 | 715 | −2 | Rising delinquencies, BNPL reporting, continued student loan pressure |
| 2026 (projected) | 713–715 | Flat to −2 | Mortgage delinquency rising, subprime pressure continuing |
The 2023 Peak Was Historically Unusual — Not the New Normal
The pandemic-era rise in average credit scores — from 703 in 2019 to 718 in 2023 — was driven by extraordinary circumstances: government stimulus that reduced missed payments, forbearance programs that paused delinquency reporting, and reduced consumer spending that lowered credit card utilization. The decline since 2023 is not a crisis — it is a return toward pre-pandemic norms, accelerated by real financial pressure on specific segments of borrowers. A national average of 715 is still significantly higher than it was a decade ago.
Credit Score Ranges — What Each Tier Means
Both FICO and VantageScore use a 300–850 scale. Here is how scores are classified under the standard FICO framework — the most widely used in lending decisions:
The national average of 715 sits in the Good range, near the midpoint between Good and Very Good. This means roughly half of Americans score in the Good or below range, and roughly half score in the Very Good or Exceptional range.
Where Does Your Score Stand Nationally?
You qualify for the best rates on every credit product. Lenders compete for your business. Very few Americans reach this tier.
You are well above the national average. You qualify for excellent mortgage rates and premium credit cards. Small improvements have diminishing returns at this level.
You are at or above the national average of 715. You qualify for most credit products, though not always at the best rates. Improving to 740+ unlocks meaningfully better mortgage rates.
You are below the national average. You can still access credit but will pay higher interest rates. FHA mortgages are accessible; conventional loans are harder. Focus on utilization and payment history.
Access to mainstream credit is very limited. Secured cards and credit builder loans are the primary tools. Recovery is possible — most consumers in this range improve significantly within 12 to 24 months of focused effort.
Average Credit Score by Age Group in 2026
Credit scores correlate strongly with age — not because older people are more financially responsible, but because credit history length is a significant factor in scoring models. More years of account history naturally produces a higher score, all else being equal.
Compare Your Score to Your Age Group — Not Just the National Average
If you are 25 years old with a score of 695, you are well above average for your generation (Gen Z average: ~680) — even though 695 is below the national average of 715. Age-adjusted comparison is more meaningful because it controls for the single biggest structural advantage in credit scoring: time. A 25-year-old simply cannot have 20 years of credit history. Comparing your score to your generational peers gives you a fairer picture of where you actually stand.
Average Credit Score by State in 2026
Average credit scores vary significantly by state — driven by differences in income levels, unemployment rates, cost of living relative to wages, and local economic conditions. Here are the highest and lowest scoring states:
| Rank | State | Avg FICO Score | Tier |
|---|---|---|---|
| 1 | Minnesota | 742 | Very Good |
| 2 | Vermont | 740 | Very Good |
| 3 | Wisconsin | 738 | Very Good |
| 4 | New Hampshire | 737 | Very Good |
| 5 | South Dakota | 735 | Very Good |
| — | National Average | 715 | Good |
| 46 | Louisiana | 689 | Good (low) |
| 47 | Alabama | 687 | Good (low) |
| 48 | Arkansas | 686 | Good (low) |
| 49 | Georgia | 684 | Good (low) |
| 50 | Mississippi | 681 | Good (low) |
Even the Lowest-Scoring State Averages in the “Good” Range
A notable feature of 2025 and 2026 data is that even the lowest-scoring U.S. states — Mississippi at approximately 681 — still average in the Good range under FICO classification. This is a legacy of the pandemic-era score improvements that lifted all states above their pre-2020 averages. Before 2020, several states averaged in the Fair range. The current environment, while showing declining averages nationally, has not yet pulled any state’s average back below 670.
Why the National Average Is Declining in 2026
The two consecutive years of average score decline since the 2023 peak are not random. They reflect specific, identifiable economic pressures concentrated in specific borrower segments:
Average Score by Scoring Model — FICO vs VantageScore in 2026
One of the most important and underreported facts about credit scores in 2026 is that your score is not a single number — it varies significantly depending on which model is used to calculate it. The same credit file can produce different scores under different models.
| Scoring Model | Approx. National Average | Key Differences vs FICO 8 | Used For |
|---|---|---|---|
| FICO Score 8 | 715 | The benchmark — most widely cited average | Credit cards, personal loans, many lenders |
| Classic FICO (5, 2, 4) | Similar to FICO 8 | Older model — factors medical collections, ignores rent/utility | Traditional mortgage underwriting |
| FICO 10T | Varies — trended data changes scores | Uses 24-month trended data — rewards improving behavior | Now approved for mortgages |
| VantageScore 4.0 | Often higher than FICO for many consumers | Ignores medical collections; counts rent/utility when reported; lower minimum requirements | Now approved for Fannie Mae, Freddie Mac, FHA mortgages |
You Likely Have a Higher VantageScore Than FICO Score in 2026
Because VantageScore 4.0 ignores medical collections entirely and gives credit for rent and utility payment history when reported, most consumers with medical collections or reported alternative data will have a noticeably higher VantageScore 4.0 than their Classic FICO score. Check both — your FICO Score 8 is available free via Experian’s free account, and your VantageScore is available free via Credit Karma. If the gap is large, this tells you something important about which lender to choose and which scoring model to seek out when applying for credit.
What Your Score Means for Loans, Cards, and Mortgages in 2026
A credit score is not just a number — it is a key that opens or closes specific financial doors. Here is what each score tier means for the most important credit products in 2026:
| Score Range | Mortgage Access | Auto Loan Rate | Credit Cards Available | Personal Loan Rate |
|---|---|---|---|---|
| 800–850 | Best rates — all loan types | ~5–6% (best tier) | All premium cards | 7–10% |
| 740–799 | Excellent rates — conventional easy | ~6–7% | Most premium cards | 10–13% |
| 670–739 ← National Avg | Good rates — conventional accessible | ~7–9% | Most standard cards | 13–18% |
| 580–669 | FHA accessible; conventional harder | ~10–15% | Secured + some unsecured | 20–28% |
| 300–579 | Very limited — FHA with 10% down | 15–25%+ | Secured cards only | 28%+ or denied |
The 700→740 Jump Is the Most Valuable Score Improvement in 2026
For most borrowers, improving from the low 700s to 740 or above unlocks the most meaningful rate improvements in dollar terms. On a $400,000 30-year mortgage, the difference between a 7.25% rate (available at 700) and a 6.75% rate (available at 740+) is approximately $130 per month — or over $46,000 over the life of the loan. The 700-to-740 range is where the most actionable rate-improvement opportunities exist for the majority of American borrowers who are currently near the national average.
How to Move Above the National Average in 2026
If your score is at or below 715 — the national average — here are the most effective steps to move into the Very Good range (740+), ordered by impact and speed:
Reduce Credit Card Utilization Below 30% — Ideally Below 10%
Utilization is 30% of your FICO score and the fastest-moving factor. Every dollar you pay down on a credit card balance improves your ratio and, once reported, improves your score — typically within 30 days. If your combined credit card balances represent more than 30% of your total credit limits, paying them down is the single highest-ROI action you can take. Use our free utilization calculator to find your exact target paydown amount.
Check for Errors on All 3 Credit Reports
Pull your free reports at AnnualCreditReport.com. A significant percentage of credit reports contain at least one error — and errors that damage scores are more common than most people realize. Look for: accounts that are not yours, incorrect payment statuses, duplicate negative entries, and outdated items past their 7-year reporting window. Dispute any errors directly with the relevant bureau online. Removing a major error can add 30 to 100+ points immediately. Full guide: How to Dispute Credit Report Errors in 2026.
Add Alternative Data — Rent, Utilities, Phone
If you are paying rent, utilities, or a phone bill, these payments can now be added to your credit file and factored into your VantageScore 4.0. Start with Experian Boost (free, immediate, adds utility and phone history to Experian). Then consider a rent reporting service like Rental Kharma or Rock the Score for TransUnion and Equifax. This is especially impactful for consumers near the national average who do not have obvious errors or high utilization to fix. Full guides: Rent Reporting 2026 and Utility Reporting 2026.
Never Miss a Payment Going Forward
Payment history is 35% of your FICO score — the largest single factor. Set up autopay for at least the minimum payment on every account. A single missed payment on a good credit file can drop a score 60 to 110 points. Consistent on-time payments, compounding over 12 to 24 months, will produce more score improvement than any other single factor for consumers who have no errors or collections to fix.
Do Not Close Old Accounts or Apply for Multiple New Cards
Closing an old credit card reduces your available credit (raising utilization) and eventually shortens your average account age. Applying for multiple new cards in a short period generates multiple hard inquiries, each dropping your score 5 to 10 points. Both are common mistakes that push scores below the national average unnecessarily. Keep old accounts open with at least one small annual purchase to prevent issuer closure, and limit new credit applications to one or two per year.
See Exactly Where Your Score Stands and How Long to Improve
Use our free Credit Score Estimator and Credit Rebuild Timeline tools — see your estimated FICO range and a personalized timeline to reach 740, 760, or 800+.
Frequently Asked Questions
What is the average credit score in America in 2026?
The average FICO score in the United States was 715 as of 2025 — the most recent full-year data available heading into 2026. This is down from the pandemic-era peak of 718 in 2023 and marks the second consecutive year of average score declines. A score of 715 falls in the Good range (670–739). The national average is expected to remain under pressure in 2026 due to rising mortgage delinquencies, student loan repayment challenges, and elevated credit card utilization among many households.
What is a good credit score in 2026?
Under the standard FICO scale, 670 or above is considered Good. 740 or above is Very Good — this is the threshold for the best mortgage rates at most lenders. 800 or above is Exceptional — the top 20% of consumers. The national average of 715 means that if your score is above 715, you are above average. Above 740, you are in the top third of American consumers by credit score.
What is the average credit score by age in 2026?
Scores increase with age due to credit history length. Approximate averages by generation: Gen Z (18–26) around 680, Millennials (27–42) around 690, Gen X (43–58) around 709, Baby Boomers (59–77) around 745, Silent Generation (78+) around 760. Comparing your score to your age group is more meaningful than comparing to the national average — a 25-year-old with a 695 is well above average for their generation even though 695 is below the national average of 715.
Why did the average credit score drop in 2025 and 2026?
The decline from the 2023 peak of 718 to 715 in 2025 was driven by: student loan delinquencies after forbearance ended, rising credit card balances due to inflation and higher interest rates, increasing mortgage delinquencies among subprime borrowers, and more BNPL missed payments being reported to bureaus. The decline reflects real financial pressure on specific borrower segments — not a change in scoring methodology.
What credit score do you need for a mortgage in 2026?
For FHA loans, typically 580 with 3.5% down or 500 with 10% down. For conventional loans, typically 620 minimum — though 700+ gets significantly better rates. For the best conventional mortgage rates, aim for 740 or above. Importantly, if your lender uses VantageScore 4.0 (now approved for Fannie Mae, Freddie Mac, and FHA), medical collections that hurt Classic FICO scores are ignored — making your effective score potentially much higher under that model.
Which state has the highest average credit score?
Minnesota consistently ranks first with an average around 742, followed by Vermont (~740), Wisconsin (~738), New Hampshire (~737), and South Dakota (~735). Mississippi has the lowest average at approximately 681 — but even that is in the Good range under FICO classification. State averages are driven by local income levels, unemployment rates, and cost of living relative to wages.
How does my credit score compare to the national average?
The national average FICO score is 715. Above 715 means you are above average. Above 740 puts you in the top third. Above 800 puts you in the top 20%. Below 670 means you are below the Good threshold and will face higher interest rates on most credit products compared to the average American borrower. For the most useful comparison, check your score against the average for your age group rather than just the national average.
Related Guides
Related Free Tools
- Experian — Average Credit Score in America (Annual Report)
- FICO — Credit Score Education and Ranges
- Equifax — April 2026 Consumer Pulse: The Latest Consumer Credit Trends
- Stacker — What’s in Store for Our Money in 2026
- CFPB — Consumer Financial Protection Bureau Official Blog
- VantageScore — VantageScore 4.0 Fact Sheet
- Experian — Credit Score Scale and Ranges Explained